coursera-data-engineering
Week 3 Optional Lab:
Implementing Monitoring with Amazon CloudWatch
In this lab, you will use Amazon CloudWatch tools to monitor a bastion host architecture.
1 - Introduction
Your team is responsible for designing, developing and deploying database instances via a bastion host (also known as a jump server). This intermediary server acts as a gateway, allowing secure access to other servers within a private network. A new requirement has come from leadership to your team, they want to closely monitor the architecture and set up an alarm in case the bastion host fails. Your task for this lab is to learn more about the monitoring tools provided by Amazon CloudWatch while working with a similar architecture as the previous lab.
The infrastructure consists of the following components:
VPC: A Virtual Private Cloud in which your solution will reside.EC2: A virtual instance that will work as a bastion host on a public subnet.RDS: A relational database instance that will reside in a private subnet group.Public Subnets: Subnets inside the VPC with internet access.Private Subnets: Subnets inside the VPC without internet access.
2 - Infrastructure deployment using Terraform
The first step in this lab will be setting up the infrastructure using
Terraform. In your Cloud9 terminal, change the working directory to the terraform folder:
cd terraform
and then, run the initialization command:
terraform init
Execute the following command to generate the execution plan:
terraform plan
To deploy infrastructure, run the command
terraform apply
Type yes and you will see the process of resources creation. This process will
take around 7-10 minutes.
You are already familiar with this infrastructure. There are only some small
changes: one is the user data installing some packages in your bastion host;
the second one is in your RDS in which the performance insights to monitor
your Database has been enabled.
To check that, open the terraform/modules/bastion_host/rds.tf file and at
the resource "aws_db_instance" "database" you will see a new key
named performance_insights_enabled set as true, which allows you to keep
track of several metrics in your RDS.
3 - Test the Infrastructure
Once the infrastructure has been deployed successfully, you will connect to the database using the bastion host. You can get the database endpoint from the previous output or running the command:
terraform output db_host
This command will output the password (all of the outputs are in double quotes):
terraform output db_master_password
In order to connect to the bastion host, there are several options such as:
- Connecting directly to the bastion host using SSH.
- Creating an SSH tunnel connection to the bastion host from your development environment.
In particular, you will connect through the SSH tunnel as it is a more elegant way to connect to a remote server. Now, let’s create the SSH tunnel connection.
Execute the following command, replacing
<RDS-HOST>with the output from the commandterraform output db_host,<DATABASE-PORT>with the output from the commandterraform output db_port,<BASTION-HOST-DNS>with the output from the commandterraform output bastion_host_dns.
Make sure that you run it from the terraform folder.
ssh -i de-c2w3lab2-bastion-host-key.pem -L 5432:<RDS-HOST>:<DATABASE-PORT> ubuntu@<BASTION-HOST-DNS> -N -f
Confirm the connection by typing in yes and pressing Enter.
Move back to the parent directory:
cd ..
With the tunnel configured, you can access the RDS by using this command:
psql -h localhost -U postgres_admin -p 5432 -d postgres --password
You will be prompted to write down the database password
which is an output from the command terraform output db_master_password
(do not include the double quotes!). Then, execute the following command:
CREATE DATABASE sbtest;
You will use this database later so do not log out or do not close this terminal.
To exit the attempt either press Ctrl+S (it also might be Cmd+S, Ctrl+Q or
Ctrl+C or typing quit and pressing Enter).
4 - CloudWatch Logs and Metrics
Amazon CloudWatch is a comprehensive monitoring and observability service. It provides a unified view of operational health and performance across AWS resources and applications enable effective monitoring, logging, and alerting. To showcase the Cloudwatch capabilities, you are going to create a Cloudwatch dashboard to show some metrics from the deployed RDS.
4.1 - CloudWatch Showcase
Open a new Cloud9 terminal and go back to the terraform folder:
cd ~/environment/terraform
Open the main.tf file from the terraform folder. Uncomment the module named
monitoring (lines 13 to 20). Save changes to the file.
Then, in the terraform/modules/monitoring folder, open the cloudwatch.tf file and
uncomment only the resource "aws_cloudwatch_dashboard" "rds_dashboard" (lines
1 to 94). You can use hotkeys Ctrl+/ or Cmd+/. Save changes to the file.
In this resource, there is a key named dashboard_body;
this is where you define the position, size and content of the dashboard elements.
Inspect this key, you will find some widgets of text type,
like the title of the dashboard, and other widgets of metric type. Between the
metrics that you are going to monitor you can find the CPU Utilization, Free
Storage Space, Read/Write IOPS and the number of Database Connections in your RDS.
Those metrics are shown as an average over a window of 30 seconds.
In your Cloud9 terminal, deploy your new resources with the following commands:
terraform init
terraform plan
terraform apply
Remember to write yes to apply the changes. Now, in the AWS console, search
for Cloudwatch, and click on Dashboards button in the left panel. You
will find the dashboard that you just deployed.
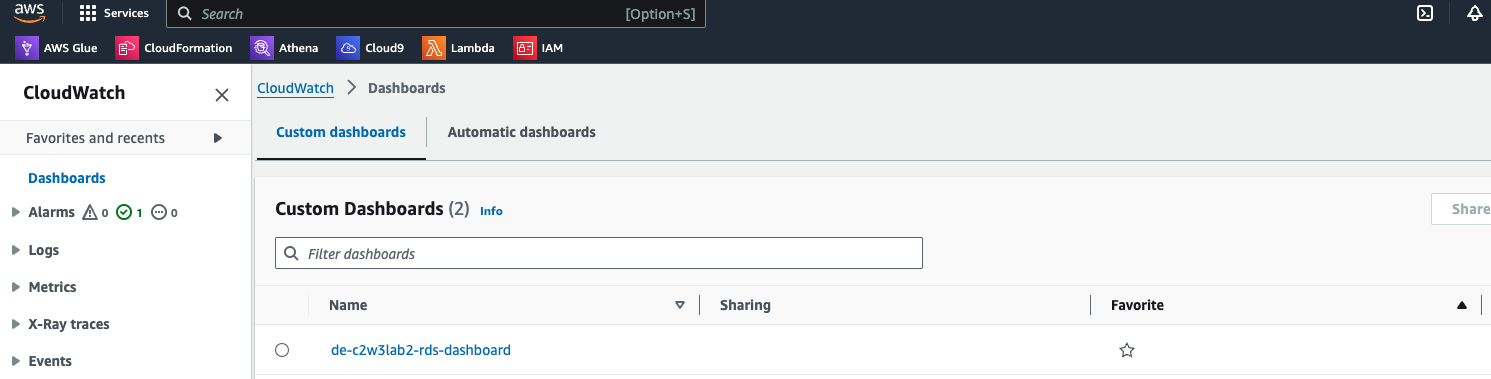
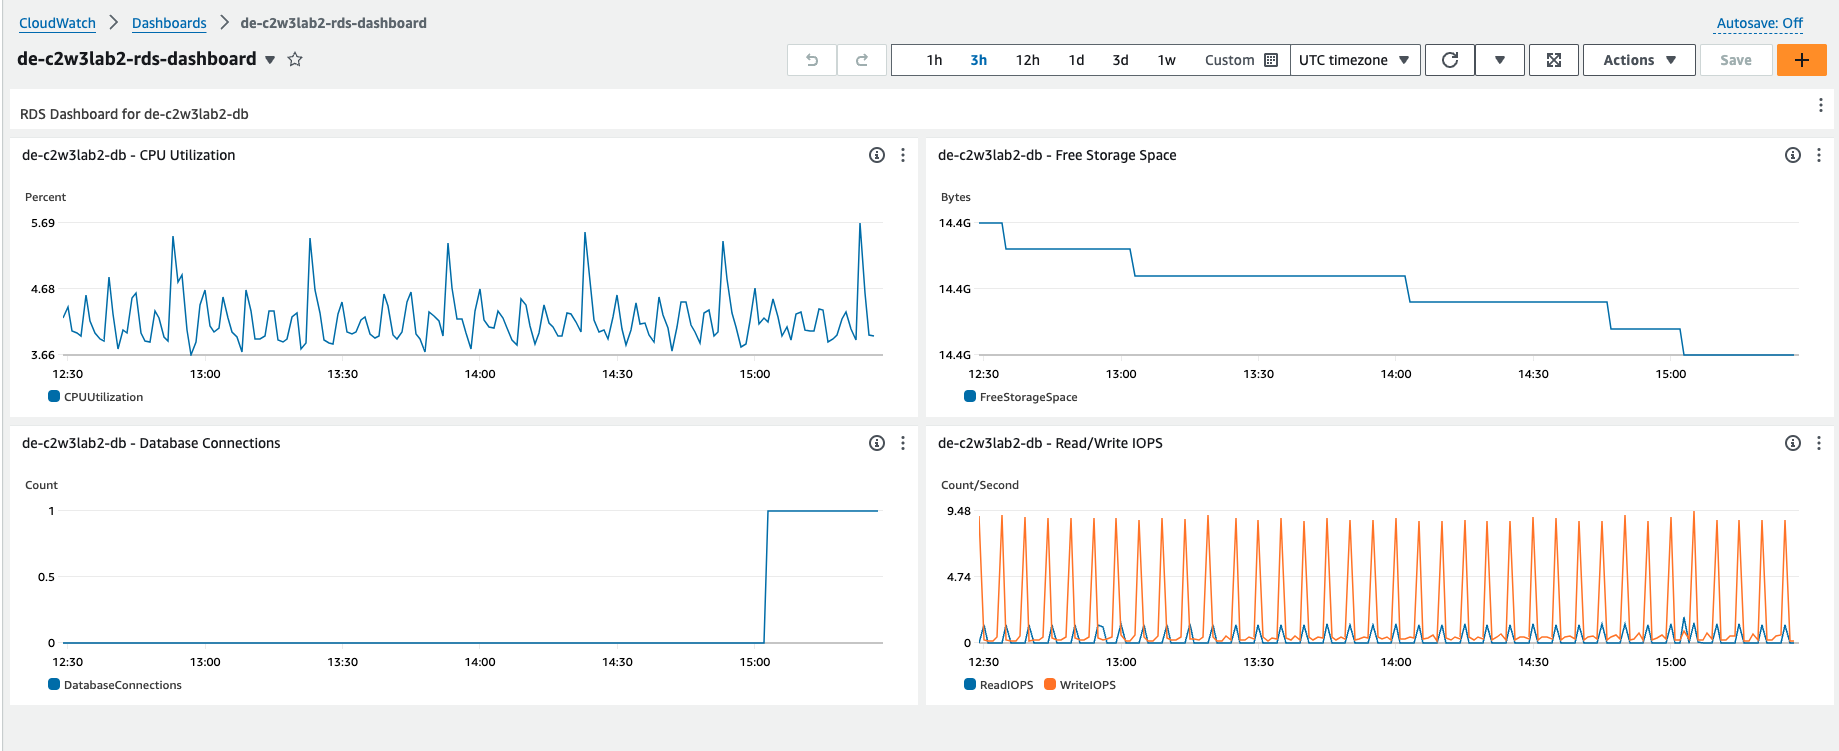
Open your dashboard and you will see the four metrics that were created.
You can export those metrics to Cloudwatch and add those metrics to the dashboard. You can find more information on this AWS video tutorial.
4.2 - Monitoring your Metrics
To monitor your metrics, you are going to perform some tests with a tool
named sysbench. Sysbench is a popular
open-source benchmarking tool designed to evaluate the performance of various
system components, including databases like PostgreSQL. It is particularly useful
for stress testing and performance tuning. Sysbench can benchmark CPU, memory,
file I/O, and database performance. It also supports multiple databases,
including MySQL, PostgreSQL, and Oracle. You are provided in an installation
of sysbench in your bastion host.
Go back again to the AWS console and search for EC2. In the left panel, click
on Instances. Search for your bastion host instance de-c2w3lab2-bastion-host
and click on its ID. Then, click on Connect.

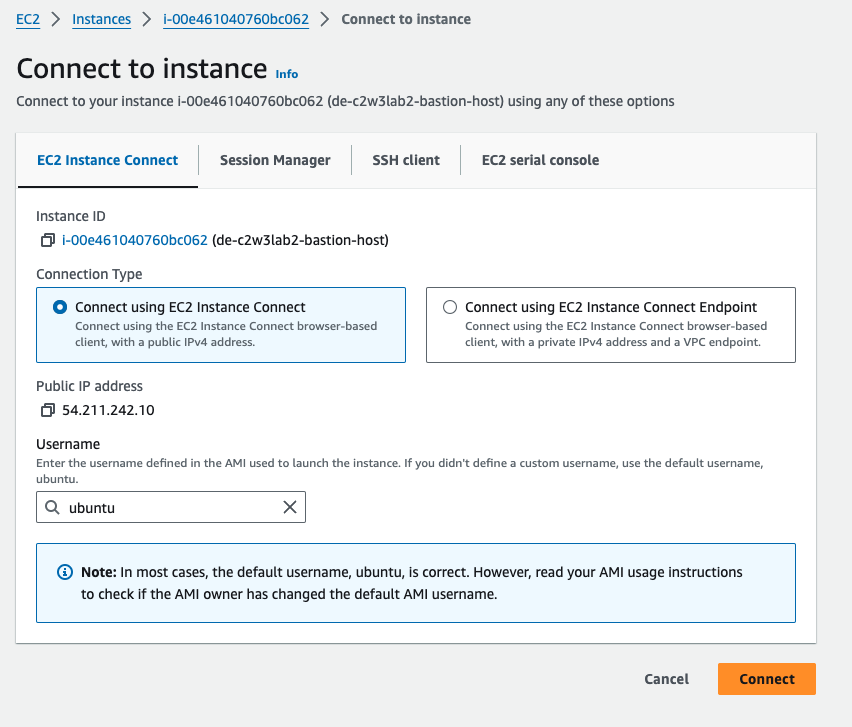
You will be prompted to the terminal to interact with your bastion host.
Let’s perform a first test by executing the following command in your bastion host terminal. Make sure to fill the placeholders with the necessary information:
sysbench /usr/share/sysbench/oltp_insert.lua \
  --db-driver=pgsql \
  --table-size=1000000 \
  --tables=15 \
  --threads=1 \
  --pgsql-host=<RDS-HOST> \
  --pgsql-port=5432 \
  --pgsql-user=postgres_admin \
  --pgsql-password=<DB-PASSWORD> \
  prepare
Let’s understand what this command does and the options used:
--table-size=1000000: Sets the size of each OLTP (Online Transaction Processing) table to 1.000.000 rows. This defines how many rows will be inserted into each table during the preparation phase.--tables=15: Specifies the number of OLTP tables to be created. In this case, 15 tables will be created.--threads=1:Defines the number of threads to use. Here, only one thread is being used./usr/share/sysbench/oltp_insert.lua: This is the path to the Lua script that Sysbench will execute. Theoltp_insert.luascript is used to prepare the database by creating the necessary tables and populating them with data.prepare: The action to perform. In this case, it tells Sysbench to prepare the database.
This command connects to a PostgreSQL Database, and executes the oltp_insert.lua
to prepare the database by creating 15 OLTP tables, each one with one million rows.
Execute the previous command and go back to your Cloudwatch Dashboard to monitor the state changes of your defined metrics. You should see a peak in the CPU Utilization and Read/Write IOPs charts, while the Free Storage Space will start decreasing. This setup can take between 5 to 7 minutes.
5 - Monitoring your Architecture with CloudWatch Alarms
5.1 - Creating the Alarms
Now, go back to Cloud9 and open the terraform/modules/monitoring/cloudwatch.tf file.
Uncomment the resources associated with the Alerts (lines 97 to 123). Save
changes.
This is the description of the recourses:
aws_cloudwatch_metric_alarm: This resource creates a CloudWatch alarm that monitors the status of a bastion host instance in EC2.aws_sns_topic: This resource creates an SNS topic to send notifications when the CloudWatch alarm is triggered.aws_sns_topic_subscription: This resource creates a subscription to the SNS topic, allowing notifications to be sent to an email address.
Make sure to only uncomment those 3 resources; the RDS Alert must remain commented as you will work on that later.
Open the terraform/variables.tf file and search for the variable
named notification_email. In the default key, write down your e-mail replacing
the placeholder <EMAIL-FOR-MONITORING>.
This e-mail will be used to send you notifications and alerts.
Then, deploy the new infrastructure:
terraform plan
terraform apply
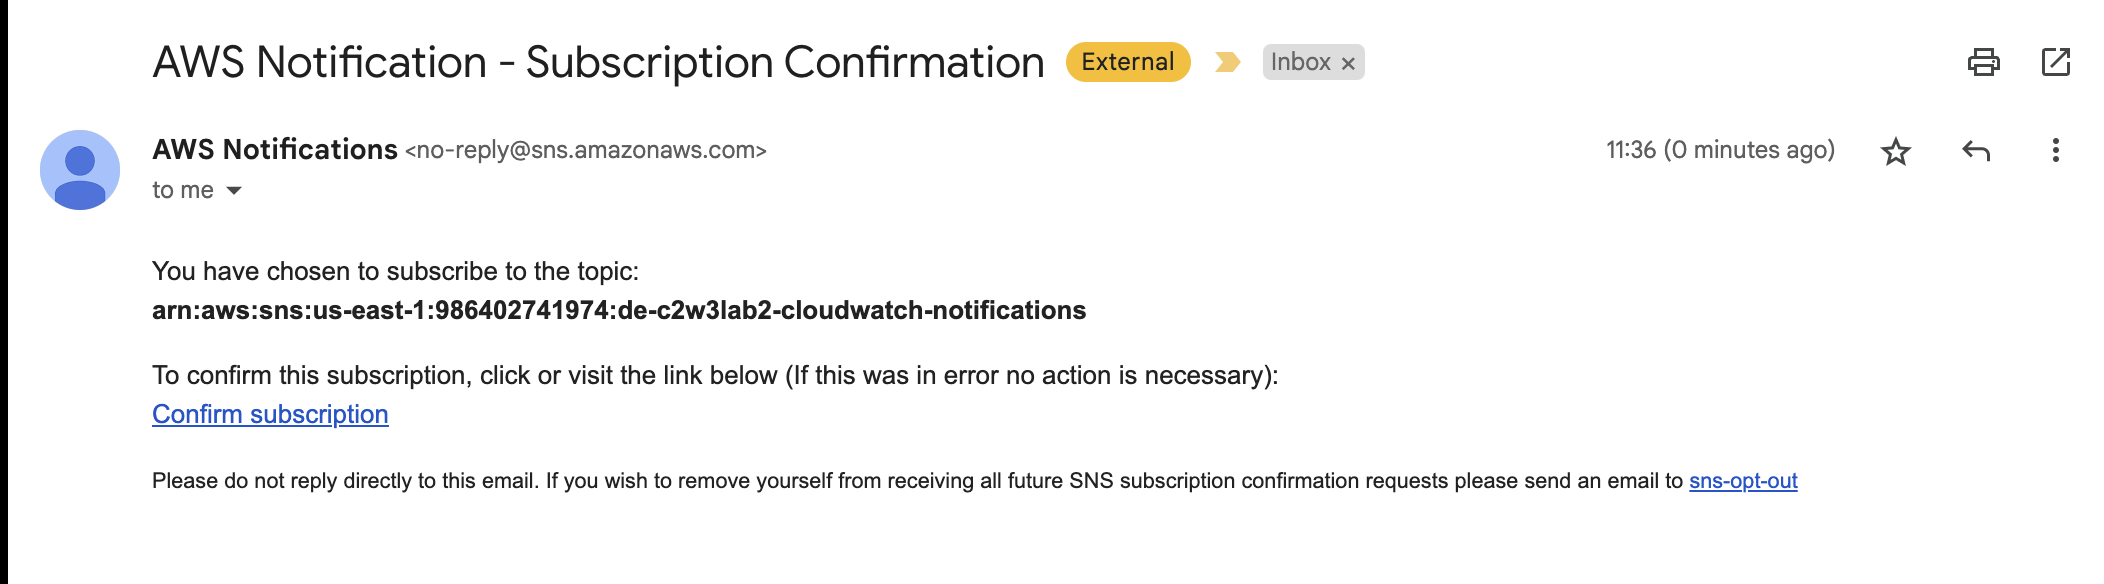
Once those resources have been deployed, a subscription should be sent to the e-mail that you added as the notification mail.
Monitoring your infrastructure is a vital part of keeping it reliable and it
allows you to detect failures early and bring the system back online after
any unforeseen issue. In this lab, the monitoring module created a CloudWatch
alarm to keep a check on the health of the bastion host and an SNS topic and
subscription to send an email in case the alarm is triggered. The subscription
you accepted before was to this SNS topic, when the bastion host fails you should
get a notification.
You will artificially trigger an alarm by shutting the network interface of the bastion host.
Go to the terraform directory:
cd terraform
Get bastion host DNS:
terraform output bastion_host_dns
Now run the following command replacing the <BASTION-HOST-DNS> placeholder:
ssh -i de-c2w3lab2-bastion-host-key.pem ubuntu@<BASTION-HOST-DNS> sudo ifconfig ens5 down
Note: there will be an empty line as an output from this command.
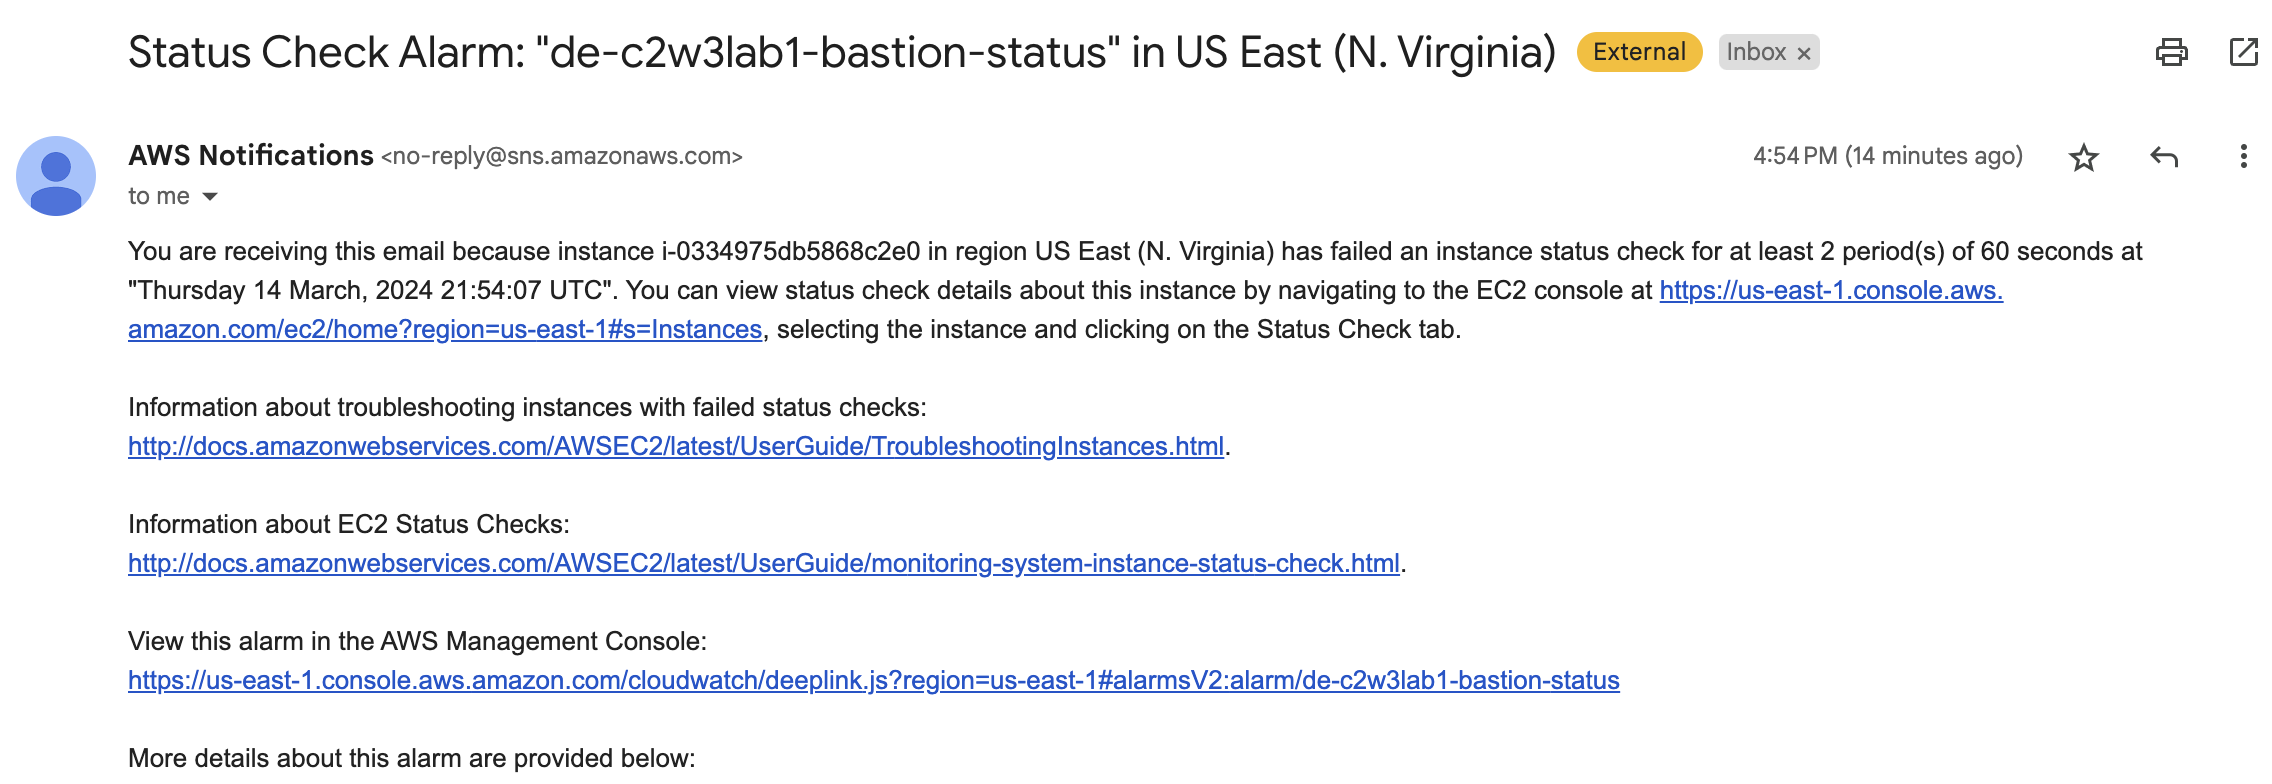
The alarm will take some time to trigger, but after about 10 minutes you should have received an email with the details of the alarm. Such as this:
Stop the command run by pressing Ctrl+S (it also might be Cmd+S,
Ctrl+Q or Ctrl+C).
Once you receive the notification, go to the AWS console, search for EC2, select your
bastion host and click on Instance State; then, click on Reboot.
5.2 - Creating New Alerts for RDS
Now, you are going to create a new alert for your RDS instance. Open
the terraform/modules/monitoring/cloudwatch.tf file, uncomment the last section
(lines 125 to 142) and complete the code associated with the resource RdCpuUsage:
- Set the number of evaluation periods to 2.
- You will check the CPU Utilization. The associated metric name is
"CPUUtilization". - Set the period to
"60"seconds. - Your CPU utilization threshold is 20%. Set the
thresholdkey to “20”.
Don’t forget to save the changes. Then, deploy your new resources with:
terraform plan
terraform apply
Connect again to your bastion host to create a new sysbench test with the following command. You will
need to replace the placeholders <RDS-HOST> and <DB-PASSWORD> with the corresponding values.
sysbench /usr/share/sysbench/oltp_read_write.lua \
  --db-driver=pgsql \
  --report-interval=5 \
  --table-size=1000000 \
  --tables=15 \
  --threads=64 \
  --time=300 \
  --pgsql-host=<RDS-HOST> \
  --pgsql-port=5432 \
  --pgsql-user=postgres_admin \
  --pgsql-password=<DB-PASSWORD> \
  --pgsql-db=sbtest \
  run
This script will mimic some real-world OLTP transactions over the database. In this case, the options used are the following:
--report-interval=2: Sets the interval (in seconds) at which Sysbench will report intermediate results.--threads=64: Specifies the number of threads used in the test. This will increase the number of simultaneous database connections.--time=300: The duration of the test in seconds.oltp_read_write.lua: These scripts simulate an OLTP workload. It executes a mix of read and write operations to simulate this real-world workload composed of read (SELECT), write (INSERT) and update/delete operations.
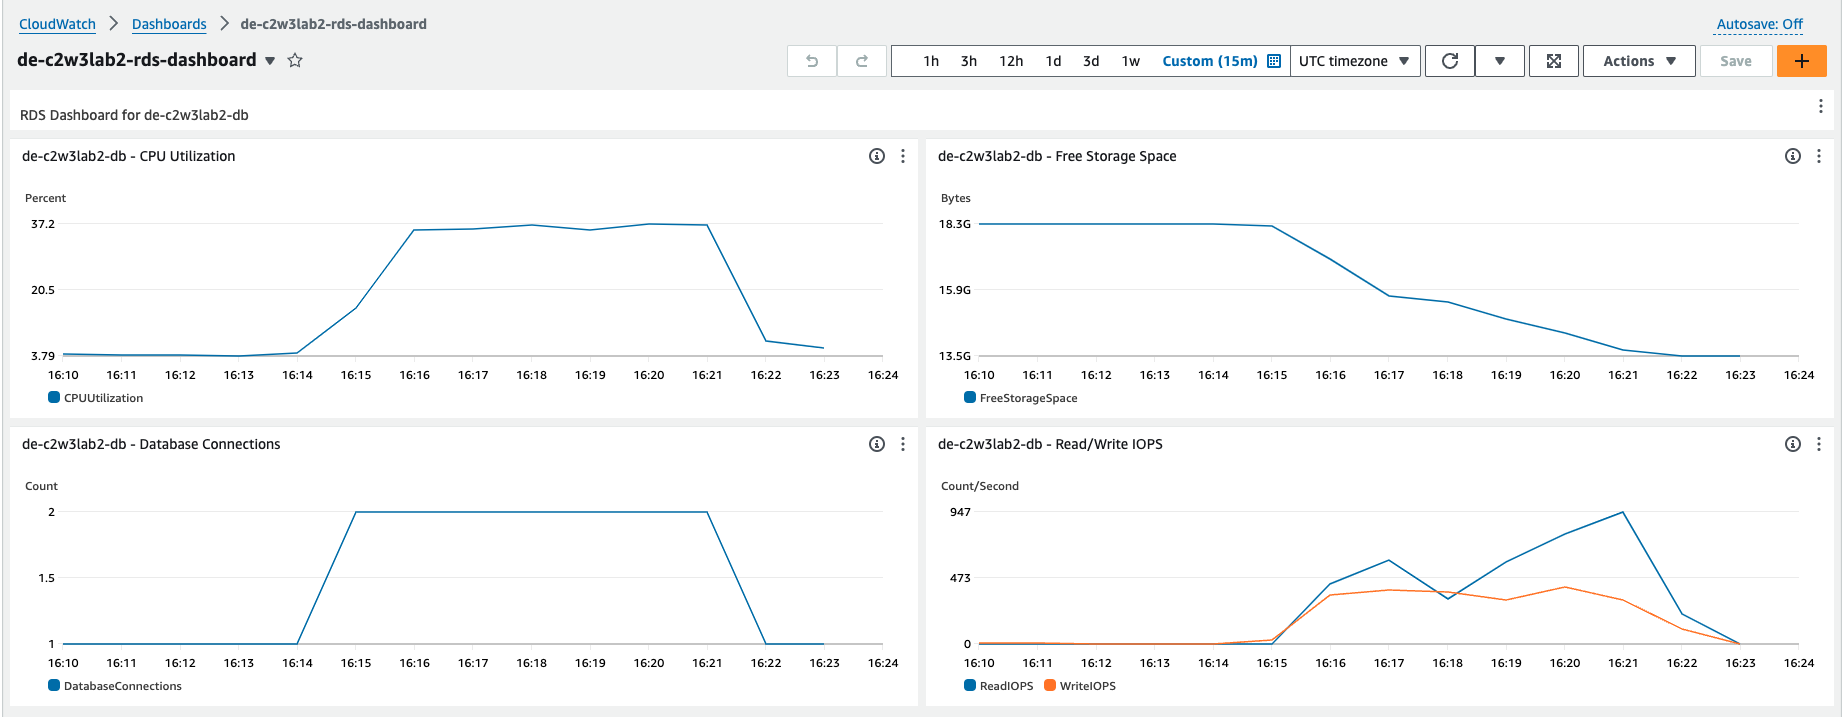
This test will last for 5 minutes. You can check your dashboard to see the increase in CPU Utilization. Furthermore, a new notification should be sent to your e-mail reporting that the CPU usage has reached the threshold you expected.
6 - Tear Down your Infrastructure
Another important advantage of using an IaC tool to manage your infrastructure
is that you can easily destroy some resources or even tear down your whole
infrastructure. The cleaning process is easier to perform when you are not going
to use a certain infrastructure anymore. To do so, check that you are in the
terraform directory and run the following command:
terraform destroy
Execute the command in the terminal to clean up the unwanted resources.
You will see the execution plan for the destruction process and will be asked
for confirmation. Answer yes to perform the cleanup process.
Congratulations! In this lab, you’ve successfully implemented DataOps principles using Terraform as an Infrastructure as Code (IaC) tool to create some monitoring and alerting resources, such as an Amazon CloudWatch dashboard and notifications to your email to check the status of your resources.